

Financial statements are reports that are based on the operation’s accounting records and these reports provide pertinent information on the operation’s activities. Management must be able to read, understand, and evaluate financial statements in order to control the costs. There are two basic reports: the income statement and the balance sheet.
Understanding the Income Statement
An income statement displays the profit or loss that a company has realized over a specific period, such as a year. The statement reports sales, cost of sales, and the other expenses. The margin between sales and costs equals the profit or loss.
The income statement is a company’s financial statement that indicates how the revenue is transformed into the net income. It displays the revenues recognized for a specific period, and the costs and expenses charged against these revenues, including write-offs (e.g., depreciation and amortization of various assets) and taxes.
The purpose of the income statement is to show managers and investors whether the company made or lost money during the period being reported.
The important thing to remember about an income statement is that it represents a period of time. This contrasts with the balance sheet, which represents a single moment in time.
Read Also: Goats Farming Complete Practical Guide
Usefulness and Limitations of the Income Statement
Income statements should help investors and creditors determine the past financial performance of the enterprise, predict future performance, and assess the capability of generating future cash flows through report of the income and expenses.
However, information of an income statement has several limitations:
- Items that might be relevant but cannot be reliably measured are not reported (e.g., brand recognition and loyalty).
- Some numbers depend on accounting methods used (e.g., using FIFO or LIFO accounting to measure inventory level).
- Some numbers depend on judgments and estimates (e.g., depreciation expense depends on estimated useful life and salvage value).
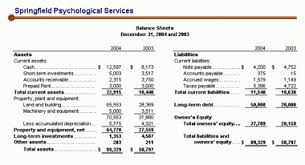
Exploring the Balance Sheet
The balance sheet reports the financial condition of the company at a point in time. The basic design of the balance sheet is based on the fundamental accounting equation:
Assets = Liabilities + Equity
Current assets are cash and other assets that will convert into cash within one year. Fixed assets are the tangible permanent resources of the business. Current liabilities are amounts payable within one year. Long-term liabilities are amounts payable beyond a year.
Role of the Balance Sheet in Financial Statements
For every business, there are three important financial statements that must be examined: the Balance Sheet, the Income Statement, and the Cash Flow Statement.
The balance sheet tells investors how much money the company has, how much it owes, and what is left for the stockholders. The cash flow statement is like the checking account; it shows where the money is spent. The income statement is a record of the company’s profitability. It tells how much money a corporation made (or lost).
Ratio Analysis of the Balance Sheet
1. Liquidity Ratios
Liquidity ratios show the company’s ability to pay its current liabilities.
- Current ratio = Current assets / Current liabilities
- Quick ratio = (Cash + Marketable securities) / Current liabilities
2. Asset Management Ratios
This shows how a company effectively and efficiently manages its assets.
- Accounts Receivable Turnover Ratio = Net Revenue / (Net Average Accounts Receivable)
- Average Collection Period Ratio = 365 / (Accounts Receivable Turnover Ratio)
- Inventory Turnover Ratio = (Cost of Goods Used) / (Average Goods Inventory)
- Turnover Period = 365 / (Inventory Turnover Ratio)
Where:
- Net Average Accounts Receivable = (Net Accounts Receivable at the Beginning of the Year + Net Accounts Receivable at the End of the Year) / 2
- Average Goods Inventory = (Goods Inventory at the Beginning of the Year + Goods Inventory at the End of the Year) / 2
3. Debt Management Ratios
Measure the company’s solvency (i.e., the company’s ability to meet its long-term obligations).
Debt-to-Equity Ratio = (Total Liabilities) / (Total Equity)
Analyzing Financial Statements in Agriculture
Financial analysis is the process of examining components of financial statements and their relationship to other components in the statement to gain deeper understandings of the company’s performance.
Purpose of the Income Statement
The primary purpose of the income statement is to report a company’s earnings to investors over a specific period of time. Years ago, the income statement was referred to as the Profit and Loss (or P&L) statement, and has since evolved into the most well-known and widely used financial report on Wall Street.
Many times, investors make decisions based entirely on the reported earnings from the income statement without consulting the balance sheet or cash flow statements (which, while a mistake, is a testament to how influential it is).
Read Also: Introduction to Ruminant Animals Production
Using Income Statement Analysis for Financial Insights

To a serious investor, income statement analysis reveals much more than a company’s earnings. It provides important insights into how effectively management is controlling expenses, the amount of interest income and expense, and the taxes paid.
Investors can use income statement analysis to calculate financial ratios that will reveal the rate of return the business is earning on the shareholders’ retained earnings and assets (in other words, how well they are investing the money under their control).
They can also compare a company’s profits to its competitors by examining various profit margins such as the gross profit margin, operating profit margin, and net profit margin.
1. Total Revenue or Total Sales
The first line on any income statement is an entry called total revenue or total sales. This figure is the amount of money a business brought in during the time period covered by the income statement. It has nothing to do with profit.
The revenue figure is important because a business must bring in money to turn a profit. If a company has less revenue, all else being equal, it is going to make less money. For startup companies and new ventures that have yet to turn a profit, revenue can sometimes serve as a gauge of potential profitability in the future.
Many companies break revenue or sales up into categories to clarify how much was generated by each division. Clearly defined and separate revenue sources can make analyzing an income statement much easier. It allows more accurate predictions on future growth.
2. Cost of Revenue, Cost of Sales, Cost of Goods Sold (COGS)
Cost of goods sold (COGS) is the expense a company incurred in order to manufacture, create, or sell a product. It includes the purchase price of the raw material as well as the expenses of turning it into a product. Cost of goods sold (COGS) is also known as cost of revenue or cost of sales.
3. Gross Profit
The gross profit is the total revenue subtracted by the cost of generating that revenue. In other words, gross profit is sales minus cost of goods sold. It tells how much money a business would have made if it didn’t pay any other expenses such as salary, income taxes, office supplies, electricity, water, rent, etc.
In an income statement, it is required that gross profit be broken out and clearly shown on its own line so that it cannot be missed. Gross profit is calculated thus:
Total Revenue – Cost of Goods Sold (COGS) = Gross Profit
The gross profit figure is important because it is used to calculate the gross margin.
4. Gross Profit Margin
Although we are only a few lines into the income statement, we can already calculate our first financial ratio. The gross profit margin is a measurement of a company’s manufacturing and distribution efficiency during the production process. The gross profit tells an investor the percentage of revenue/sales left after subtracting the cost of goods sold.
A company that boasts a higher gross profit margin than its competitors and industry is more efficient. Investors tend to pay more for businesses that have higher efficiency ratings than their competitors, as these businesses should be able to make a decent profit as long as overhead costs are controlled (overhead refers to rent, utilities, etc.)
To calculate gross profit margin, use this formula: Gross Profit ÷ Total Revenue
5. Operating Expense
The next section of the income statement focuses on the operating expenses that arise during the ordinary course of running a business. Operating expense consists of salaries paid to employees, research and development costs, legal fees, accountant fees, bank charges, office supplies, electricity bills, business licenses, and more.
The general rule of thumb is that if an expense does not qualify as a cost of goods sold, meaning it is not directly related to producing or manufacturing a good or service, it goes under the operating expense section of the income statement. There are several categories, the biggest of which is known as selling, general, and administrative expense.
The biggest challenge to controlling operating expenses is a risk known as agency cost. It is the inherent conflict between owners and managers. Those that work in the business are always going to want nicer offices, more secretaries, better facilities, faster computers, free lunches, or whatever else they can imagine.
These are easier to control if a small business is operated, but options are limited if shares in a large corporation are owned.
Selling, General, and Administrative Expenses (SGA)
SGA expenses consist of the combined payroll costs (salaries, commissions, and travel expenses of executives, salespeople, and employees), and advertising expenses a company incurs.
High SGA expenses can be a serious problem for almost any business. A good management will often attempt to keep SGA expenses limited to a certain percentage of revenue. This can be accomplished through cost-cutting initiatives and employee layoffs.
Do you have any questions, suggestions, or contributions? If so, please feel free to use the comment box below to share your thoughts. We also encourage you to kindly share this information with others who might benefit from it. Since we can’t reach everyone at once, we truly appreciate your help in spreading the word. Thank you so much for your support and for sharing!