To study an animal population, a statistical description of the population is required. This description, in its simplest form, consists of a measure of central tendency and a measure of the variability of the population.
Ordinarily, measurements on the entire population are not available. However, by studying a sample of observations from the population, a statistic can be derived that describes the sample and provides estimates of the corresponding population.
Normal Curve and Measures of Central Tendency
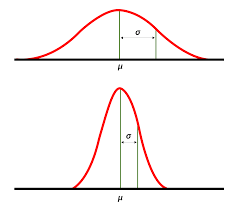
Most biological measurements can be considered normally distributed. A distinctive feature of this normal distribution is that values are clustered at a mid-point, thinning out symmetrically toward both extremes. The height of the curve at a particular point represents the frequency of individuals having that particular value.
There are at least three common measures of central tendency: mean, median, and mode. The mean represents the average of all measurements in a population; the median represents the class value halfway between the two extreme values; and the mode represents the class with the highest frequency.
For a true normal distribution, the mean, median, and mode will coincide. However, the most useful statistic in estimating central tendency in most populations is the mean, since samples from a normally distributed population may show some departure from normality.
The population mean is merely the arithmetic average of all the values included in the population. It is conventionally represented by the symbol μ for a population mean and Xˉ for a sample mean. Individual measurements in a sample can be symbolized by X1, X2, X3 …, Xn, and the mean can be computed as follows:
Xˉ = (X1+X2 +X3+ ⋯ Xn)/n
Where n is the number of observations included in the sample.
Read Also: How to Raise Ruminant Animals for Fattening and Reproduction together
Variance as a Measure of Variation

The measurement of variation in a trait or character is called variance, which can be divided into different components. The amount of variation is measured and expressed as variance when values are expressed as deviation from the population mean.
The variance is usually denoted by σ2 for population variance and S2 for sample variance, defined as the average of the squared deviations from the mean. It is the most useful measure of variation for studying the variability of a population.
The total phenotypic variance of a population (σ2P), which measures observable variation, can be broken into two portions: genetic variance (σ2G), which is the variance among genotypic means, and environmental variance (σ2E), which is the remaining variance often classified as the variance due to environmental deviations.
If the phenotype is the sum of genetic and environmental effects, then P = G + E.
If the genotypes are not distributed randomly across environments, there will be some covariance between genotype and environmental values, and this covariance will be hidden in the genetic and environmental variance.
All measures of the importance of genes are framed in terms of the proportion of variance attributable to their variations.
Since in reality, only a sample from the population is available, estimates of population variance can be computed using the following formula:
S2 = [(X1 – Xˉ)2 + (X2 – Xˉ)2 + ⋯ + (Xn – Xˉ)2] / (n – 1)
Since deviations are squared, variance is a positive value with zero as the lower limit. The sum of the squared deviations from the mean is divided by n-1 rather than n to compute the sample variance. Dividing by n-1 provides an unbiased estimate.
Read Also: Fattening Ruminants? Find out the Best Sex to Raise
Standard Deviation and Its Importance

The standard deviation is the square root of the variance; it is symbolized by σ for population and s for sample. While variance is expressed in squared units (e.g., kilograms squared, centimeters squared), the standard deviation is expressed in the original measurement units (e.g., kilograms, centimeters). Since the standard deviation is the square root of variance, it can be computed as follows:
√[(X1 – Xˉ)2 + (X2 – Xˉ)2 + (X3 – Xˉ)2 + ⋯ + (Xn – Xˉ)2] / (n – 1)
Coefficient of Variation (CV) in Animal Breeding
The standard deviation expressed as a percentage of the mean is termed the coefficient of variation (CV). It is used to compare the variability of traits measured in different units. The formula for computing CV is:
CV = (S / Xˉ) x 100
Variation is the raw material breeders need to make appropriate selections for herd improvement. Without variation, selection cannot occur.
Variation among animals in a population is the raw material available for breeders to make selections for herd improvement. The variation observed in a population arises from both geand environmental influences.
Genetic variations result from differences in genes, while environmental variations result from environmental factors, both of which act together to determine the phenotype of an individual in the population. The mean or average of observations and a measure of variability around the mean are needed to describe the distribution of values for a particular trait.
Do you have any questions, suggestions, or contributions? If so, please feel free to use the comment box below to share your thoughts. We also encourage you to kindly share this information with others who might benefit from it. Since we can’t reach everyone at once, we truly appreciate your help in spreading the word. Thank you so much for your support and for sharing!

