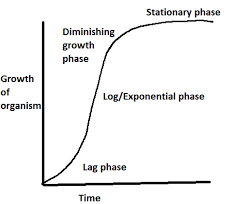
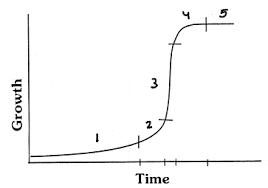
The Sigmoid Growth Curve is a pattern of growth of an organism in a new environment where by the population density of that organism increases slowly initially, in a positive acceleration phase, then increases rapidly approaching an exponential growth rate then declines in a negative form.
A growth curve is an empirical model of the evolution of a quantity over time. Growth curves are widely used in natural sciences for quantities such as population size or biomass for population growth analysis, individual body height or biomass. Values for the measured property can be plotted on a graph as a function of time.
Phases of the Sigmoid Growth Curve
Any population growing exponentially starts off slowly, goes through a rapid growth phase, and then levels off once the carrying capacity of the area is reached. Plotting a graph of such a population yields an S-shaped curve. This curve can be divided into three phases:
- Exponential
- Transitional
- Plateau
1. Exponential Growth Phase
Initially, population growth will be slow (lag period) as there are few reproductive individuals that are likely widely dispersed.
As numbers accumulate, there is a rapid increase in population size as natality greatly exceeds mortality
Mortality is low because there are abundant resources and minimal environmental resistance.
Population growth is fastest during the exponential growth phase because (birth rate + immigration) exceeds (death rates + emigration).
2. Transitional Phase

As the population continues to grow, resources eventually become limited, which leads to competition for survival.
Natality rates start to fall and mortality rates begin to rise, leading to a slowing of population growth.
Population growth slows down during the transitional phase because disease, predation and competition set limits to population increase.
Disease spreads faster as populations get larger and therefore reduces the number of individuals who can reproduce.
Predators can hunt more successfully as the prey population increases, which in turn increases the population of predators (negative feedback).
Resources become scarce when a population is large, which in turn increases competition.
3. Plateau Phase
Eventually the increasing mortality rate equals the natality rate and population growth becomes static.
The population has reached the carrying capacity (κ) of the environment, with limiting factors keeping the population stable.
Read Also : How to treat Ruminant Animal Diseases
The population size at this point will not be constant, but will oscillate around the carrying capacity to remain even.
Population growth is zero at the plateau phase because it has reached its carrying capacity, which is the maximum population size that an environment can support.
At carrying capacity, populations tend to produce more offspring than can be supported by the environment. This leads to extreme competition for resources such as food, shelter, nesting space and so on.
The Sigmoid Curve

S-shaped growth curve (sigmoid growth curve) is pattern of growth in which, in a new environment, the population density of an organism increases slowly initially, in a positive acceleration phase; then increases rapidly approaching an exponential growth rate as in J-shaped curve but then declines in a negative acceleration phase until at zero growth rate the population stabilizes.
This slowing of the rate of growth reflects increasing environmental resistance which becomes proportionately more important at higher population densities.
This type of population growth is termed ‘density dependent’ since growth rate depends on the numbers present in the population.
The point of stabilization, or zero growth rate, is termed the ‘saturation value’ or ‘carrying capacity’ of the environment for that organism.
The peak point represents the point at which the upward curve begins to level, produced when changing population numbers are plotted over time.
Importance of the Sigmoid Curve
The sigmoid curve is extensively used in the study of population dynamics of fast growing organisms like yeast. Its importance lies in the fact you can:
- Describe growth in size across time.
- Model human size as a function of age
- Indicate a time of maximum growth and the asymptotic location of the maximum growth rate.
In summary, growth curves are widely used in biology for quantities such as population size or biomass for population growth analysis, individual body height or biomass.
The sigmoid curve is extensively used in the study of population dynamics of fast growing organisms like yeast. Values for the measured property can be plotted on a graph as a function of time.
Any population growing exponentially starts off slowly, goes through a rapid growth phase, and then levels off once the carrying capacity of the area is reached. Plotting a graph of such a population yields an S-shaped curve.
Read Also: Is pawpaw farming profitable
