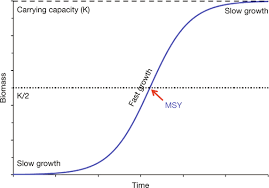
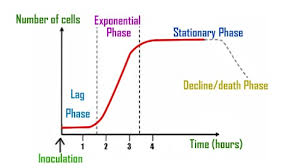
The sigmoid growth curve represents a pattern of growth for an organism in a new environment, where the population density initially increases slowly in a positive acceleration phase, then rises rapidly toward an exponential growth rate, followed by a decline in a negative acceleration phase.
A growth curve serves as an empirical model to show the evolution of a quantity over time. Growth curves are commonly used in natural sciences to analyze population growth, biomass, individual body height, or biomass. These properties can be plotted on a graph as a function of time.
Read Also: Pawpaws: History, Nutrition, Health Benefits and Growing Guide
Phases of the Sigmoid Growth Curve

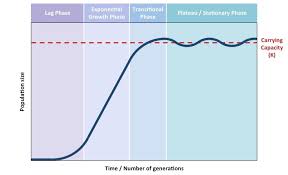
Any population growing exponentially will experience a slow start, followed by rapid growth, and eventually level off when the carrying capacity of the area is reached. A graph plotting such a population creates an S-shaped curve. This curve can be divided into three phases:
- Exponential Growth Phase
- Transitional Phase
- Plateau Phase
1. Exponential Growth Phase
During the initial phase, population growth is slow (lag period) as there are few reproductive individuals, and they are likely widely dispersed. As the population accumulates, there is a rapid increase in numbers as natality (birth rates) greatly exceeds mortality.
Mortality is low because there are abundant resources and minimal environmental resistance. The growth rate is highest in this phase because the birth rate, combined with immigration, exceeds the death rate, coupled with emigration.
2. Transitional Phase
As the population continues to grow, resources become limited, leading to competition for survival. Natality rates start to fall, and mortality rates begin to rise, causing the population growth to slow down.
This phase is marked by factors such as disease, predation, and competition, which limit population increase. As populations grow larger, diseases spread more rapidly, reducing the number of individuals capable of reproducing.
Similarly, predators can hunt more efficiently, increasing the predator population (a form of negative feedback). Resources also become scarcer with larger populations, resulting in increased competition.
3. Plateau Phase
Eventually, the mortality rate equals the natality rate, causing the population growth to stabilize. At this point, the population reaches the environment’s carrying capacity (κ), with limiting factors maintaining population stability. The population size will fluctuate around the carrying capacity, remaining relatively even.
Population growth is zero at the plateau phase, as the population has reached the maximum size the environment can support. At carrying capacity, the population tends to produce more offspring than the environment can support, leading to intense competition for resources such as food, shelter, and nesting space.
Read Also: Feijoas: History, Nutrition, Health Benefits and Growing Guide
The Sigmoid Curve of Population Growth

The sigmoid growth curve is an S-shaped curve that represents population growth in a new environment. Initially, the population density increases slowly during the positive acceleration phase. It then increases rapidly, approaching an exponential growth rate, much like a J-shaped curve.
However, it later declines in a negative acceleration phase, stabilizing at zero growth. This deceleration of growth is due to increasing environmental resistance, which becomes more significant as the population density rises.
This form of growth is termed “density-dependent” because the growth rate depends on the population size. The point where the population stabilizes, or the zero growth rate is reached, is called the “saturation value” or “carrying capacity” of the environment.
This peak point represents the point where the upward curve begins to level off, reflecting the limits imposed by the environment.
Importance of the Sigmoid Growth Curve
The sigmoid curve is widely used in the study of population dynamics, particularly for fast-growing organisms like yeast. Its significance lies in the ability to:
- Describe growth in size across time.
- Model human size in relation to age.
- Indicate the time of maximum growth and the asymptotic location of the maximum growth rate.
Growth curves are essential tools in biology for analyzing quantities like population size, biomass, and individual body growth. The sigmoid curve is crucial in studying the dynamics of rapidly growing organisms and can effectively depict how an organism’s growth evolves over time.
Do you have any questions, suggestions, or contributions? If so, please feel free to use the comment box below to share your thoughts. We also encourage you to kindly share this information with others who might benefit from it. Since we can’t reach everyone at once, we truly appreciate your help in spreading the word. Thank you so much for your support and for sharing!

